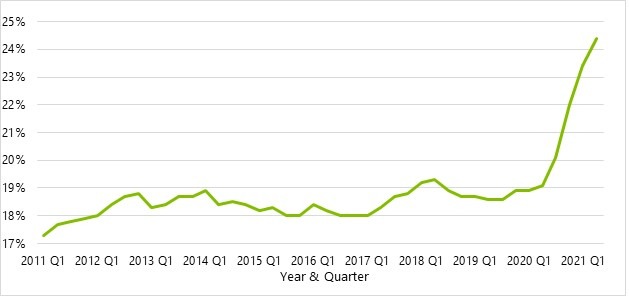
Sometimes, a shock as damaging as a pandemic has a beneficial underside for the economy. For example, we’ve seen a surge in entrepreneurship emerge from the COVID-19 economic shock, as evident in a proliferation of applications to start new businesses. The chart below shows the rate of “high-propensity” business applications filed in New Jersey. As the chart shows, the pace of these applications increased from a rate of approximately 3,000 per month pre-pandemic to near 4,000 now – up more than 30%. The high propensity distinction is important, as these are applications for new businesses likely to be incorporated and create positions for new workers, as separate from applications for businesses likely to be unincorporated sole proprietorships. In this way, these businesses are likely to provide the main sources of income for their owners and provide employment for others.

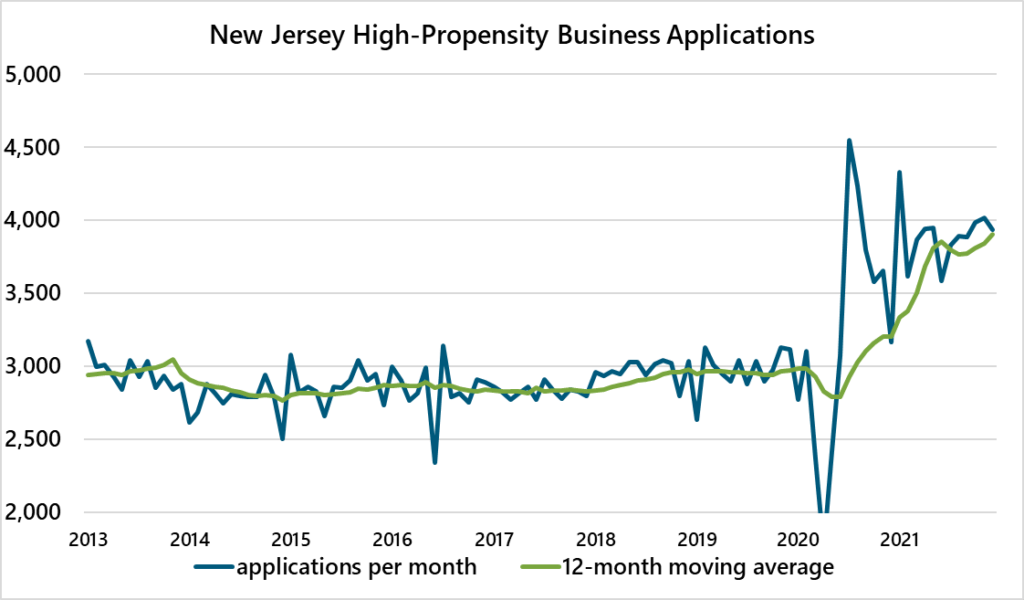
The cause of this jump in business creation is up for dispute. From our lens, a mix of jobs lost and abundant opportunities to innovate encouraged many people to venture out on their own instead of relying on the status quo. The benefit of this entrepreneurship wave is likely self-evident, but it’s worth noting that entrepreneurship benefits the economy as a whole as well as the individual entrepreneurs. For the economy, entrepreneurship drives the evolution necessary to keep an economy growing. For individuals, entrepreneurship and the value created therein generates economic opportunities and wealth.

So, who are all these new entrepreneurs? For New Jersey, the evidence suggests a growing share of these entrepreneurs in New Jersey are Black. There are few datasets that provide information on business ownership by race, and the ones that do exist tend to release data with a one-to-two-year lag. Thus, if we want to examine in real time what is happening to business ownership by race, we need to rely on proxies of business ownership.

To this end, we follow a method used by Dr. Robert Fairlie[1] with University of California, Santa Cruz, to estimate small business ownership by race using Current Population Survey (CPS) microdata on self-employment. The CPS is a monthly nationwide survey of individuals that includes questions on labor market status, such as employed or unemployed and, if employed, whether the individual is salaried worker or self-employed. As did Fairlie, we use data on self-employment as a proxy for small business ownership. Fairlie reasoned business ownership could be estimated this way because, if a person is a small business owner, that person is going to identify as self-employed. Moreover, we only include self-employment where it is indicated as the primary employment source. Many people are employed in a wage and salary position and own a business as a secondary source of income, and we do not wish to include these estimates in our dataset.

The chart below shows the growth of small business ownership by race, indexed at the 2019 level = 100. We are forced to smooth the data using 12-month moving averages as the data are not seasonally adjusted and are very volatile on a month-to-month basis.

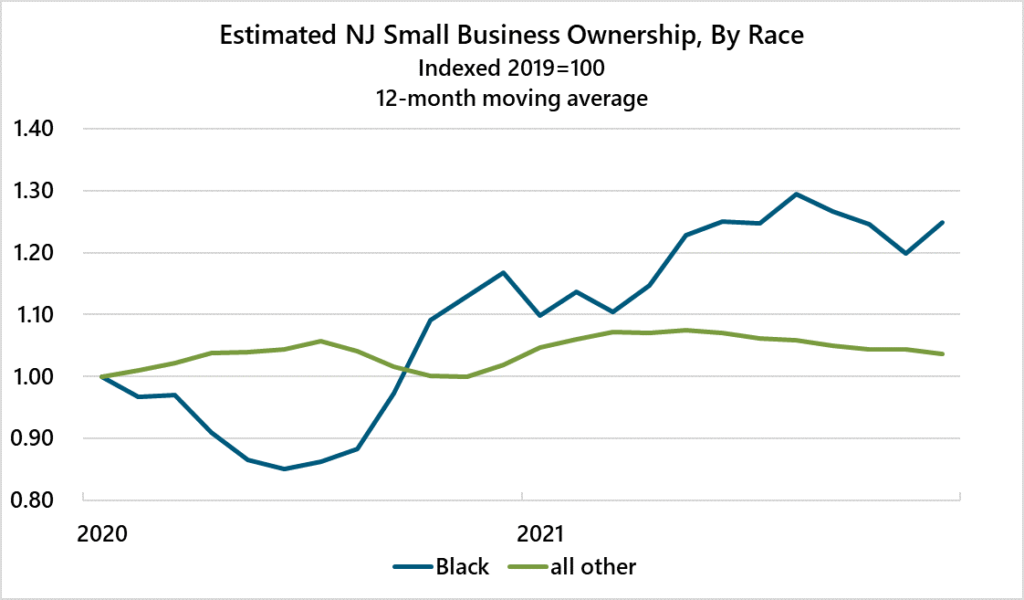
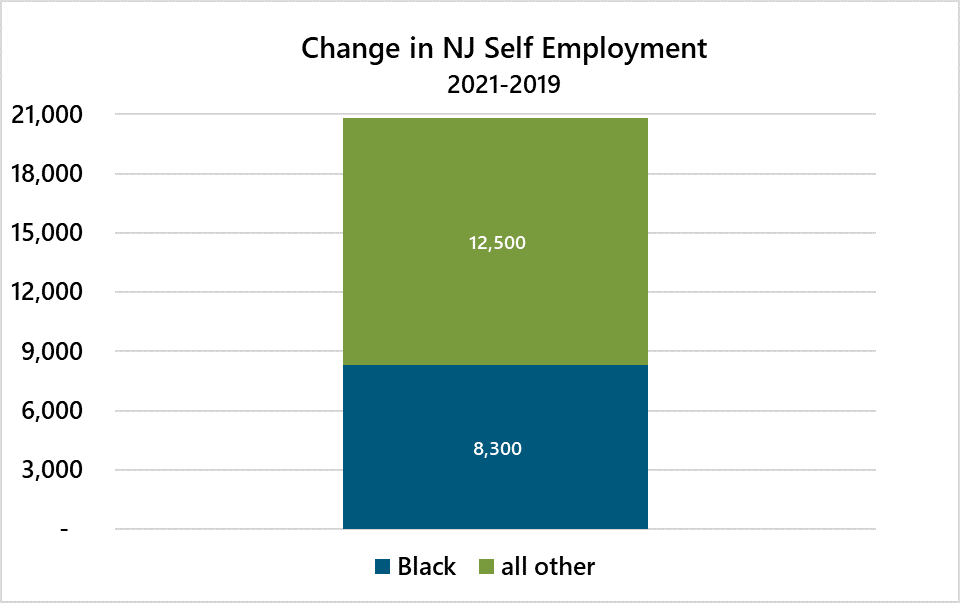
As the above chart shows, Black people were much more likely than the rest of the population to suffer a loss of small business at the start of the pandemic. But since that time, Black business ownership has surged. Relative to the 2019 level, Black business ownership is up approximately 25%. This compares to around 4% for the rest of the population. This comparison between Black and non-Black self-employment is further demonstrated in the chart below, which shows the change in self-employment in 2021 relative to 2019. Of the approximately 20,800 increase in self-employment, almost 40 percent is from Black residents. Given Black residents account for approximately 20 percent of New Jersey’s labor force, the 40 percent share of self-employment shows Black residents are taking up a surprisingly large share of recent new business creation.

The evidence of growing entrepreneurship in the Black community is a welcome sign. But, in order for this growth in entrepreneurship to yield long-term results, these small business owners often require outside sources of financial capital to invest in and grow their ventures. Small businesses are usually strapped for cash – most of the money earned goes into paying for the operating costs of the businesses, leaving little for investment. For instance, the Census Bureau’s Small Business Pulse[2] shows that, for New Jersey, the median business has less than three months of free cash on hand. This clearly isn’t enough to invest in and grow the business.

Unfortunately, access to credit is where the Black community has had one of its biggest challenges with entrepreneurship and business cultivation. The New Jersey Economic Development Authority (NJEDA) has been working with the Federal Reserve to understand gaps in credit access for minority small business owners. Our research shows Black people and other people of color are less likely to have access to credit. These disparities are about more than simply being banked or unbanked – there exists more of a middle ground impacted by the strength of relationships and availability of collateral. As part of this work, we will be meeting with credit organizations, such as community banks and community development financial institutions (CDFIs), to better understand how they approach business with minority small business owners and see where gaps in credit access might be closed.

Moreover, in an effort to close some of these gaps, the NJEDA provides credit and grants to small businesses that might not be able to secure traditional bank financing. Our small business products include improvement grants, lease assistance, direct loans and loan guarantees and participations, as well as direct loans to other credit providers such as CDFIs to help lever credit products. The NJEDA also partners with the African American Chamber of Commerce of New Jersey to offer a Small Business Bonding Readiness Assistance Program to help businesses position themselves to bid on government contracts. The NJEDA wants to ensure that all New Jersey businesses have the resources necessary to expand and that our communities have a healthy climate for growth. As the evidence shows a jump in Black entrepreneurship, our hope is that the work being done with the Federal Reserve and through our programs will support access to credit so these businesses can thrive.


[1] See Fairlie, R. (2020). The impact of COVID‐19 on small business owners: Evidence from the first three months after widespread social‐distancing restrictions. Journal of economics & management strategy, 29(4), 727-740.

[2] See January 9 results for New Jersey at https://portal.census.gov/pulse/data/

This latest version of The Economist’s Corner focuses on trends in New Jersey’s manufacturing sector. The report shows manufacturing in recent years is gaining an increased share of New Jersey’s economy following years of contraction. Moreover, recent trends towards job reshoring provide further impetus behind New Jersey’s manufacturing sector continuing to increase share of New Jersey’s dynamic economy.

New Jersey’s Manufacturing Sector: Industrial Vigor, as Viewed Through Four Charts

Manufacturing industry Gross State Product – Trending upward since 2018

Over the past four years, manufacturing has been one of New Jersey’s fastest expanding industries, growing at a 5.6 percent annualized pace. The strength has been concentrated in non-durable manufacturing – areas such as food and chemical products. This recent strength in manufacturing is quite a contrast to what the experience was in the aftermath of the 2008-09 recession, when manufacturing contracted at a 3.0% annualized rate through 2016.


Manufacturing, along with some other high value-added industries,
is increasing as a share of New Jersey’s economy

Not only is manufacturing expanding at a solid clip, but it is becoming an increasing share of New Jersey’s overall economy. This chart looks at how shares of GDP have changed since the period right before the pandemic to today. As the chart shows, manufacturing as a share of the economy has increased by approximately 0.5 percentage points. Manufacturing currently accounts for around 11.3 percent of private-sector GDP.


Labor market indicators and Federal Reserve surveys point to continued solid growth

Economists are always on the lookout for leading indicators that provide information on how economic activity is performing now and into the future. These next two charts do just that.

This is a chart of year-over-year changes in both the manufacturing index of hours worked and manufacturing GDP for New Jersey. The manufacturing index of hours worked is the product of the number of manufacturing employees and the hours they have worked. Essentially, it provides a measure of the amount of labor input in a given quarter. Given labor is a significant input in the manufacturing process, tracking labor output can tell us about manufacturing output. Here we see, through Q3, that manufacturing labor input continued to grow at very strong rate in line with manufacturing GDP near 10 percent year over year growth. Thus, manufacturing output continued to grow at a solid clip in Q3.

This chart shows data from two very useful surveys of manufacturing activity run by the Federal Reserve Banks of New York and Philadelphia. Here we are focused on indices for new orders, which is extremely helpful data for understanding near-term manufacturing activity because today’s orders become tomorrow’s production. Thus, when new orders are growing at a strong pace, it is a clear sign future production will, in turn, be strong.

In this context, anything above 0 indicates growth, so current levels near 20 signal double-digit growth. The one disclaimer is that it depends on whether demand is being filled by new production or previously produced inventories. However, given that inventories are stretched fairly thin currently, the ongoing growth of new orders signals a solid pace of manufacturing sector activity in Q4 and, likely, beyond.


A New Jersey Geography of Manufacturing Jobs, 2010-2019

This section provides an analysis of New Jersey residents who are manufacturing industry workers, as reported by the United States Census Bureau. The data presented here pertains to New Jersey residents and where they live, in contrast to where the manufacturing jobs or employers are located.

In the nine years just prior to the COVID-19 pandemic (2019 vs. 2010), New Jerseyans employed in manufacturing decreased from 396,000 (8.6 percent of the work force) in 2010 to 361,000 (7.7 percent of the work force) in 2019 — a 9.9 percent decrease in residents employed in manufacturing. However, there are some interesting trends throughout the state, including some places where the number of residents employed in manufacturing has increased. Moreover, as the analysis above shows, manufacturing in New Jersey in recent years is growing at a solid clip, which may reverse the shifts of the past nine years.

Top five municipalities in manufacturing worker residents in New Jersey,
by percentage of workforce, 2019 vs 2010

Looking at the raw numbers of residents in each municipality, the most populous cities unsurprisingly have the largest numbers of residents employed in manufacturing. The top five municipalities for manufacturing worker residents in 2010 included Paterson (9,884), Newark (9,327), Jersey City (7,953), Elizabeth (7,269), and Clifton (6,402). These rankings stayed mostly the same through 2019, except for the fifth spot, which switched from Clifton to neighboring Passaic. Clearly, the center of New Jersey manufacturing workers remains the northeast urban areas near New York City. The following map shows manufacturing worker density by municipality, both in levels and as a percent of labor force.


Map of manufacturing worker residents in New Jersey, levels and share of work force, 2019

Looking at the following map related to changes across the state, rural areas generally saw decreases in manufacturing employees. Whether this is caused by changes in manufacturing locations, movement of residents, or a combination of factors would need further study support. However, there is evidence from the 2020 Census that indicates rural communities are losing population.

Map of percent change in manufacturing worker
residents in New Jersey, 2019 vs 2010

Outside of the northeastern manufacturing area, there is a notable increase in manufacturing employees in Atlantic County and Southern Ocean County. It will be of interest to follow how New Jersey’s new wind port, which is being built in Salem County, supports further manufacturing sector employment in and around the region.

The towns that saw the biggest decreases in residents employed in manufacturing from 2010-2019 share some similarities to those above. Plainfield (-1,537), Newark (-1,441), Woodbridge (-1,431), and Linden (-1,265) are also in this concentrated northeast urban area, while Trenton (-1,341), which has the fourth most manufacturing residents in the state, is not.


Reshoring Jobs: a Pre-COVID Trend Accelerated by the Pandemic

Among the many lessons the world has learned from the COVID-19 pandemic is the is the vulnerability of the global supply chain. Estimates suggest the pandemic affected 98 percent of global supply chains.[1] Companies that had previously prioritized a lean supply chain model that prioritized cost reduction and just-in-time production were not well prepared for major worldwide disruptions.[2]

As a result of the pandemic, some firms started to consider “reshoring” – the practice of bringing manufacturing and services back to the United States from overseas.[3] A May/June 2020 survey of 750 North American manufacturing firms found that 69 percent were either “likely” or “extremely likely” to reshore their overseas operations.[4] It is worth noting that the pandemic did not seem to cause the sudden interest in reshoring – rather, it accelerated an existing trend.[5] Evidence shows, over the past decade, China has lost the most reshored U.S. jobs (40 percent), followed by Mexico (23 percent) and Canada (10 percent). Over the past several years, the number of jobs cumulatively reshored to the United States has increased from about 100,000 in 2013 to over 500,000 in 2020.[6] In 2020, reshoring logged a record high 109,000 jobs announced.

The pandemic was the main driver of this recent surge, but analysts also view this landmark development as a combination of other factors, including greater U.S. competitiveness due to corporate tax and regulatory cuts, and rising concern over China’s competitiveness.[7] In general, a number of variables unrelated to the pandemic factor into a company’s decision to reshore. Rising wages in hosting countries are one of the most frequently cited reasons. Other reasons include protection of intellectual property, shorter supply chains, and the value of the “Made in USA” label as factors in decisions resulting in reshoring.[8] Despite the impact of COVID-19 and some promising developments in recent years, it’s important not to assume that reshoring is inevitable. Decisions on supply chains are made based on business fundamentals such as production costs and access to large markets. COVID-19 will likely not significantly affect those factors.


[1] https://www.supplychaindive.com/news/supply-chains-reshoring-decisions-sourcing-manufacturing-china/597596/

[2] https://www.brookings.edu/research/reshoring-advanced-manufacturing-supply-chains-to-generate-good-jobs/

[3] https://www.brookings.edu/research/reshoring-advanced-manufacturing-supply-chains-to-generate-good-jobs/

[4] https://www.areadevelopment.com/BusinessGlobalization/Q1-2021/job-creation-through-reshoring.shtml

[5] https://www.areadevelopment.com/BusinessGlobalization/Q1-2021/job-creation-through-reshoring.shtml

[6] Reshoring Initiative 2020 Data Report

[7] Ibid

[8] https://www.areadevelopment.com/BusinessGlobalization/Q1-2021/job-creation-through-reshoring.shtml; https://www.supplychaindive.com/news/supply-chains-reshoring-decisions-sourcing-manufacturing-china/597596/

The Economic Recovery Remains Incomplete

If you spend some time reading the popular press on the state of the economy, you’ll likely come away with a simple story: the economy is booming as everything re-opens and pent-up demand from the past year gets filled, but constraining economic growth are shortages of goods and labor, which is causing prices to spike. Thus, the economy is running too hot for supply to keep up, and the Federal Reserve needs to raise interest rates to slow the economy and the rate of inflation.

Oh, if it were all so easy. In this story, it’s all about supply not being able to keep up with demand, so we just need some recalibration. The ongoing strength of demand is given.

The full story is, like usual, much more complex. This economic recovery is far from complete, and if policy makers do not continue to focus on supporting demand, the rebound could falter at a time when labor demand remains uneven. Policymakers in New Jersey understand this, which is why we continue to roll out programs that focus funds and other supports to areas of the economy still in need, such as the Main Street Recovery Finance Program, which is launching later this year.

To see how the economic recovery remains incomplete, it’s important to understand that a principle reason the economy is currently booming is an unprecedented and ephemeral surge in fiscal stimulus to households. Once this fiscal stimulus and its effects start to wane, the economy will slow markedly.

The following three charts demonstrate this outlook. Figure 1 shows the level of personal income in New Jersey. It has spiked in recent quarters, leading to a surge in consumer spending, as depicted in Figure 2. The reason for these spikes, as depicted in Figure 3, is largely about fiscal stimulus — money transferred from the federal government to households. As this chart shows, place of work income, which is income coming from jobs or business ownership, has rebounded smartly from its COVID low, but remains well below its pre-COVID trend. Federal government transfer payments – things like unemployment insurance and direct payments from the federal government to households (stimulus checks) – have spiked. Whereas government transfers to the New Jersey household sector averaged around $87 billion in 2019, they have averaged $158 billion in the four quarters through 2021:Q1. That’s an 11 percent jolt to the average New Jersey pre-tax income. In sum, COVID has been a boon to many households’ incomes.

Fig 1 – New Jersey Personal Income Through Q1 of 2021

Source: Bureau of Economic Analysis

Fig 2 – Consumer Spending in New Jersey, by Zip Code Groups

Source: Affinity, Opportunity Insight

s

Fig 3 – Major Sources of New Jersey Personal Income Through  Q1 of 2021

Source: Bureau of Economic Analysis

Given these surges in stimulus-led NJ household income, it’s no wonder consumer spending and GDP have shot up, putting stress on supply. But fiscal surges like these do not make for a complete economic recovery. The reason why is easy to see: unless the surge in stimulus continues unabated or income rises to offset the drop in stimulus flow, demand will likely slow once the stimulus retracts. And one thing we know – the stimulus flow to households is now retracting as unemployment insurance benefits and stimulus payments to households are stopping. 

Although household income from place of work is rising, it remains below its pre-COVID trend. There are two reasons for weaker income level we’d like to highlight. One, as depicted in Figure 4, is the level of employment for low-wage jobs remains depressed. The ex-stimulus economy looks very tenuous for these workers.

Fig 4 – Employment in New Jersey by Wage Grouping

Source: Earnin, Intuit, Kronos, Paychex, Opportunity Insights

The other is, despite the jump in job openings signaling increased demand for labor, the level of layoffs remains relatively high. This is shown in Figure 5, which depicts microdata for New Jersey households detailing the reasons why people state they are unemployed.

There are a host of reasons a person would be classified as unemployed; it’s not just about being laid off from a job. Anyone who is not currently employed but is looking to be employed is considered unemployed. This includes new entrants into the labor market, such as a recent college grad or a person who had left the labor market and now is re-entering the market, and job quitters – people who chose to leave a job in search of a new one. Even job losses differ by whether they are the results of temporary layoffs or permanent layoffs. An example of a temporary layoff is a manufacturer who closes a factory for a month to re-tool that factory. The workers in that factory would be considered temporarily laid off and would likely reclaim their positions once the factory reopens.

A look at Figure 5 reveals a somewhat concerning trend – at a high and increasing rate, New Jersey residents cite permanent layoffs as the reason for being unemployed. This is unusual for an economic rebound. Normally, when the US economy is growing out of a recession, a rising share of unemployment is for re-entrants to the labor market and a falling share of unemployment is for permanent layoffs, as we can see in the period from 2010 through 2014. Although the re-entrant share is currently rising, it is doing so at a very slow clip. Meanwhile, the share of layoffs is still rising. This suggests net labor demand is not as strong as the standard press story would have us believe.

Fig 5 – Reasons for Being Unemployed

Source: IPUMS-CPS, University of Minnesota, www.ipums.org, NJEDA Calculations

This picture of the labor market is further supported by the current level of initial claims for unemployment insurance. As shown in Figure 6, the level of claims remains around 1.5 times higher than it was pre-pandemic, which signals that, despite the surge in economic activity, the rate of layoffs remains elevated.

Fig 6 – Initial Claims for Unemployment Insurance Remain Elevated

Source: Bureau of Labor Statistics, NJEDA Calculations

In sum, despite the recent surge in economic activity and jump in job openings, the economic outlook for many households remains unclear. This is why New Jersey’s government continues to focus on policies that will provide support to households and small businesses and enable the state’s economy to keep growing as it continues to adjust to the COVID shock.

NJ Commercial Real Estate Update

Industrial CRE

The industrial market in New Jersey proved itself nearly invulnerable to the economic shock from COVID. In Northern New Jersey, Q3 of 2020 saw the highest quarterly net absorption figure in more than a decade,[1] and Southern New Jersey saw the highest leasing activity within the Philadelphia MSA over the past 12 months.[2]

At the beginning of 2020, statewide vacancy was an extremely low 3.7 percent, and during 2020, vacancy increased at most just 0.2 percent. Currently, the statewide vacancy rate rests at 3.6 percent.

Rents increased as well, indicating increased demand relative to limited supply for industrial space. In Q1 2020, overall triple-net average rent was $7.65 per sq. ft. By the end of 2020, it increased to $8.00 per sq. ft, and it currently stands at over $9 per sq. ft.

Significant Industrial Transactions: Q2 2020 – Q2 2021

Company Name

Industry

Location

Square Footage

Amazon

Logistics

Carney’s Point

1.25M sq. ft.

UPS

Logistics

Bayonne

880,000 sq. ft.

FedEx

Logistics

Newark

873,743 sq. ft.

Elogistic

E-commerce Logistics 

Mansfield

710,368 sq. ft.

PIM Brands (subsidiary of Promotion in Motion)

Candy warehousing and distribution

Somerset

308,550 sq. ft.

Misfits Market

Produce Delivery

Delanco

245,000 sq. ft.

Office CRE

The pandemic has not been kind to office markets across the world, and New Jersey is no exception. As seen in the graph below, vacancy increased to a level not seen since CoStar started tracking the market in New Jersey.

NJ Office Vacancy Rate

Net absorption[3] also saw a historic decline. Fourth quarter 2020 brought the lowest net absorption on record, and net absorption in every quarter from Q3 2020 to YTD 2021 has been sharply negative.

NJ Office Net Absorption

A rebound in the office sector will depend on a number of factors, such as vaccination rates and school re-openings. But the sector will have to contend with more companies allowing more work-from-home, which may cause a permanent contraction of office space leasing. However, a number of recent surveys indicate many employees are looking forward to being back in the office, which is good news for the sector in New Jersey. Most likely, many office tenants will adopt a hybrid work model that will dictate future square footage requirements for office tenants.

Significant Office Transactions: Q2 2020 – Q2 2021

Company Name

Industry

Location

Square Footage

Eisai

Life Sciences

Clifton/Nutley

332,818 sq. ft.

Brother International Corp.

Electrical Equipment

Bridgewater

101,724 sq. ft.

Mallinckrodt

Pharmaceuticals

Hampton

101,641 sq. ft.

Wework/Organon
 (Wework sublet to Organon)

Wework- Coworking

Organon – Life Sciences

Jersey City

110,000 sq. ft.

Lockheed Martin

Defense Industry

South Jersey (multiple locations)

320,000 sq. ft. (four lease renewals)

BAE Systems

Defense Industry

Mt. Laurel

32,463 sq. ft.

Retail CRE

Along with office, New Jersey’s retail market was certainly negatively impacted by the COVID pandemic. Net absorption for retail space statewide in Q3 2020 declined to the second lowest level ever in CoStar’s history. However, net absorption rebounded solidly in the fourth quarter of 2020, and CoStar’s analysts are forecasting net absorption will be positive starting in 2022 after seeing minimal negative absorption through 2021.

In addition, vacancy rates increased but perhaps not as drastically as initially feared. From Q2 2020 to now, statewide vacancy increased from around 4.3 percent to 5.3 percent. This reversed the trend of the previous two years, but the ills befalling retail establishments in New Jersey were not as drastic as those for office. This is likely due to people’s desire to continue visiting brick and mortar establishments, especially in light of increased vaccination rates, falling case rates, and the resultant elimination of state restrictions.

NJ Retail Net Absorption

NJ Retail Vacancy Rate

Significant Retail Transactions: Q2 2020 – Q2 2021

Company

Industry

Location

Square Footage

AMC

Movie Theater

Elizabeth

(Mills @ Jersey Gardens)

220,016 sq. ft. (lease renewal)

Total Wine

Liquor Store

Eatontown

27,467 sq. ft.

LA Fitness

Gym

Avenel

38,000 sq. ft.

Planet Fitness

Gym

Cherry Hill

19,375 sq. ft.

Goodwill

Nonprofit

Hazlet

19,180 sq. ft.

Harbor Freight Tool

Home & Garden Retail

Hazlet

19,180 sq. ft.

New Jersey’s International Trade Flows

With New Jersey’s economy moving closer to being fully re-opened, now is a good time to examine how international trade flows are faring in the aftermath of the COVID shock. At the beginning of the month, U.S.A Trade Online published trade figures through April, 2021, which marks one year from the lowest point of total exports during the pandemic when exports from New Jersey fell 29%.

It wasn’t until November 2020 that exports returned to its previous value of $3.4 billion. Since that time, exports in New Jersey have been posting consistently strong growth, with an average monthly growth rate of 2.6 percent, which is considerably stronger than the 0.1 percent m/m rate in 2019.

In fact, Not only are we seeing a consistent increase in exports, but New Jersey is also outperforming the United States, which is averaging 1.9 percent m/m since November, 2020. Thus, New Jersey’s ranking has increased post-pandemic, from 14th largest exporting state in 2019 to 8th largest exporting state so far in 2021.

While there are still many uncertainties in the long run, the newest figures for trade prove to be optimistic for New Jersey’s future in the international landscape.


[1] CoStar_Northern New Jersey – NJ Industrial market report 2021

[2] CoStar_Philadelphia_Industrial Market Report

[3] Net Absorption: For existing buildings, the measure of total square feet occupied less the total space vacated over a given period of time.

Economists love their data, and for good reason. Data enables us to understand important issues such as what factors support economic growth, impact price inflation, and alter labor flows. Right now, many people are struggling to use data to answer one very important question: is overgenerous government support for unemployed workers hindering businesses from recruiting the employees they need to recover from the COVID-19 pandemic? Today’s Economist’s Corner examines what the data has to say about this, and shows why this common, seemingly-intuitive explanation for why businesses are struggling to recruit workers likely doesn’t tell the real story.

There is a persistent narrative that unemployment insurance benefits are too generous, which is lowering the incentive of people to seek employment. At first glance, this could make intuitive sense. Currently, we are seeing a surge in job openings, most notably for jobs requiring relatively low levels of education. But at the same time small businesses are having an historically hard time filing open positions. Normally, with such high unemployment, small businesses would be having a relatively easy time finding willing workers. After all, a high unemployment rate means there is a considerably higher supply of people willing to work then there is demand for those workers. Thus, the evidence would seem to suggest the need to reduce unemployment insurance in order to get people back to work.

However, this simple explanation misses a few key pieces of data. This article addresses the problems with this narrative and suggests some alternative explanations that better fit the data and offer reasons for optimism, but before we can get into that, we need to get on the same page regarding the data that we’ll be examining.

The main way macroeconomists measure economic growth is GDP, which measures the income generated by the mix of land, labor, capital, materials, and technological progress. As for the labor markets, there are many ways to measure it. Probably most often used is the unemployment rate, which estimates the share of people in the labor market looking for a job but currently without one.

Macroeconomists also use data to examine the relationships between concepts, such as how economic growth impacts inflation and supply and demand for workers. One of the key relationships is that between economic growth and the state of the labor market. The idea that there should be a relationship between economic growth and the labor market is easy to understand – labor is a key input to economic production, so as pressure grows on the economy to expand, demand for labor should increase.

One of the best ways we have to examine this relationship is comparing the unemployment rate to what is known as the GDP gap, which estimates the difference between where GDP is and where it could be if it were running at its full potential. Think of it this way – imagine a factory running at 70% of its capacity. It has enough unused machine time to produce 30% more than what it is actually doing without having to hire more people or invest in more machinery, which is a gap between actual and potential output. Just apply that concept to the economy and you have a basic understanding of the GDP gap.

Furthermore, it makes sense that this gap would be related to the unemployment rate – an unemployment rate is, essentially, a gap in labor utilization. If the unemployment rate is at 10 percent, it means 10 percent of people who would like to be employed are not – that’s a gap. And a gap in the economy should be reflected in a gap in labor supply versus demand.

The following chart shows the relationship between the unemployment rate and the US GDP gap for New Jersey. On the chart, the unemployment rate is tracked on the y-axis and the GDP gap is tracked on the x-axis (the bottom axis). The chart shows two main things. For one, every point indicates where the unemployment rate and GDP gap were for that year. For example, in 2011, the NJ unemployment rate was 9.4 percent and the US GDP gap was -4.0 percent. The chart shows another thing – the relationship between the unemployment rate and the GDP gap. A larger (more negative) gap is associated with a higher unemployment rate. The dotted line shows the line that is the best fit for all the points. As can be seen, the data for 2020 was very close to what would be expected given the linear model fit. In sum, there is nothing strange about the 2020 level of the unemployment rate given the level of the GDP gap.

Now you might be thinking, “OK, that’s great mister economist, the unemployment rate is in line with where the GDP gap says it should be, but why are you telling me all of this?” Well, there is a reason, and it has to do with unemployment insurance.

Contrary to the argument that unemployment insurance is keeping people from taking available jobs, this chart suggests unemployment insurance is not the driving factor keeping people out of jobs. When a person is collecting unemployment insurance, that person should be officially classified as unemployed. Thus, if there were an extraordinary amount of people who were choosing to remain unemployed because of the incentive to do so, the unemployment rate would be considerably higher than what you would expect given the GDP gap. And that is not the case – the unemployment rate is right where it should be. Thus, there is no good evidence to suggest that unemployment insurance is incentivizing people to remain unemployed.

Ok, so unemployment insurance isn’t the problem. Then what is? Evidence suggests there are other disincentives aside from unemployment insurance keeping people from taking available jobs right now. Two immediately come to mind:

  1. A lack of child care remains an intractable issue.
  2. We are still in a pandemic.

To start examining these issues, it is worthwhile to look at a measure of the labor market gap that is more comprehensive than just unemployment, because one thing the unemployment rate does not capture is people who are not employed and not actively looking for employment. These are people who are out of the labor market, and as it turns out there has been a huge surge of people in 2020 who left the labor market. To capture this dynamic, a better measure of the labor market gap is the difference in employment-to-population ratio versus its trend. Employment-to-population is the share of the adult population that is employed. If a person leaves New Jersey’s labor market but remains a resident of New Jersey, that person is still counted in the denominator – population – so it better reflects all changes in labor market supply and demand. This labor market gap measure is depicted in the chart below relative to the GDP Gap.

As the chart shows, this measure of the labor market gap is beyond what would be expected given the GDP gap. Thus, there is evidence to suggest more people left the labor market in 2020 than would be expected.

So, why would so many people have chosen to outright leave the labor market? A conceivable driver is that a lack of child care is holding people – especially women – back from reentering the labor market. The following chart was produced for our previous issue of the Economist’s Corner. It shows prime-age women’s employment has dropped considerably more that of men.

Further delving into the data shows that the intersection of gender and parenthood is where the dichotomy occurs. Female parent employment fell 6.8 percent through December, 2020, which is a much larger decline than the 3.8 percent drop recorded for male parent employment. The evidence suggests that this dichotomy results from female parents shouldering a larger share of child care responsibility than male parents. Thus, when child care, including education, essentially shut down, so did female parent labor market participation.

This next chart is a reproduction from a recent National Institute of Early Education Research publication showing preschool participation rates before the pandemic, in spring 2020, and in fall 2020. Whereas 71 percent of four-year-old children were enrolled in preschool pre-pandemic, that share plummeted to 7 percent in spring and recovered somewhat to 40 percent by fall. Drops of similar magnitude were reported for three-year-old children.

Applying absolute numbers to those percentage changes, as of 2018 there were 4.4 million three- and four-year-old children enrolled in preschool. A drop of 30 percentage points in enrollment share of population would mean approximately 1.8 million fewer three- and four-year-old children enrolled. Apply New Jersey’s share of the US population to those numbers, and we have approximately 55,000 fewer New Jersey three- and four-year-old children enrolled in preschool. If each of those children at home yielded a mother out of the labor force, that alone could account for 1/3 of the drop in New Jersey’s participation rate. And that’s not even considering other child care and educational sources for other age children.

The bottom line – child care has likely been a big reason why labor supply is so slow to recover, even as demand for workers is surging.

Source: Barnett, W.S., & Jung, K. (2021). Seven Impacts of the Pandemic on Young Children and their Parents: Initial Findings from NIEER’s December 2020 Preschool Learning Activities Survey. New Brunswick, NJ: National Institute for Early Education Research.

In addition to child care keeping parents, and especially mothers and other female caregivers, out of the labor force, labor force participation is also certainly down due to the simple fact that we remain in the midst of a deadly pandemic. At this point, approximately 51 percent of New Jersey’s population has received one or two vaccine doses, but that is not near the threshold necessary for herd immunity and many people are understandably hesitant to return to work in this context, especially in jobs that require in-person interaction.

Taken together, this evidence suggests that, even with no change to unemployment insurance, as more people receive vaccines and schools and daycares reopen to full capacity, it will become easier for businesses to fill open positions. However, there remains the underlying risk that structural damage has occurred in the child care industry with child care centers and home-based businesses closing due to the pandemic, lowering the supply of child care.

It is encouraging that help is on the way via a mix of organic economic growth, continued monetary stimulus, and a new fiscal package aimed at providing support to both working and unemployed mothers. The State has undertaken a number of initiatives to support the child care sector and families in need of child care assistance in this critical moment, including increased investments in child care, waiving parent co-pays in the State’s child care subsidy program, offering grants to child care providers, and providing tuition support for school-aged supervision. For its part, the NJEDA currently has $20 million in grants to provide to small child care businesses (with fewer than 50 full-time equivalent employees). Furthermore, the federal government’s American Rescue Plan will provide New Jersey approximately $267 million in child care assistance to parents and caregivers and approximately $428 million in funds to child care providers. Thus, a substantial amount of resources is being focused on supporting the child care industry. But until these issues are remedied, it is likely businesses will continue finding it hard to recruit the labor they so sorely need.

Women in the Pandemic Labor Market

The pandemic has significantly decreased labor demand. From the outset of the pandemic through the end of 2020, prime-age employment (employment among people aged 25-54) fell by approximately five million jobs. The rate of job loss has had disproportionate impacts on women. In this age group, employment through December fell by 4.6 percent[1] for men and 5.7 percent for women. The chart below depicts the path of prime-age employment for men and women from February through December. It shows employment in the first two months of the pandemic fell much more for prime-age women (-15%) than men (-12%). Since then, the rate of employment growth for prime-age women has outpaced that of men, but the employment gender gap remains.

Source: Current Population Survey

What is interesting about this gender gap is it’s less about gender alone and more about the intersection of gender and parenthood. To be more specific, for prime-age women and men who are not parents, the data show very similar rates of change in employment. If anything, employment of non-parent women fell less than that of men. It’s only for women and men who are parents – also known as moms and dads — that this gap is quite apparent. This reveals one of the ugly truths of the pandemic: it seems many more women than men had to choose between being the primary caregiver for their children and being employed.

The chart below depicts the evidence. It shows changes in employment from February to December for all prime-age women and men, and then separately based on parental status. As the chart shows, employment of moms fell 6.8 percent, a substantially more severe drop than the 3.8 percent decline in employment of dads. For non-parents, employment of women fell less than that of men.


Source: IPUMS, Current Population Survey, NJEDA[2]


Another way to look at these outcomes is, as a result of the pandemic, a mom is almost 1.8 times more likely than a dad to no longer be employed. Moreover, if moms had the same labor market outcomes as non-parent women or dads, approximately 600,000 more moms in the US would currently be employed. There are two likely reasons for these worse outcomes for mothers. One is obvious – as the pandemic caused schools and childcare services to shut down, generally speaking, more moms took on more of the primary responsibility of caring for children. Survey evidence supports this explanation[3]. The second reason is occupational mix – women are more likely to be employed in occupations requiring physical proximity[4] and less likely to be in occupations with ability to telecommute[5]. Occupations more dependent on physical proximity and less disposed to telecommuting were more likely to be cut during the pandemic.

The encouraging news is help is on the way via a mix of organic economic growth, continued monetary stimulus, and a new fiscal package aimed at providing support to both working and unemployed mothers. The State has undertaken a number of initiatives to support the childcare sector and families in need of childcare assistance in this critical moment, including increased investments in childcare, waiving parent co-pays in the State’s childcare subsidy program, offering grants to childcare providers and providing tuition support for school-aged supervision. And there are private sector initiatives, such as Golden Seeds, which seeks to support women entrepreneurship through pooling and distribution of financial and human capital. The help is sorely needed, not only to provide current economic relief but to keep this from becoming a long-term economic problem for mothers.

The fact is, the longer someone is out a job, the harder it can be to get another one or to make up for lost income, so time is of the essence. This phenomenon is due to what economists call labor “scarring.” From an economics point of view, the key concept at play is depreciation of human capital. In essence, the longer a person is out of work, the more that person’s skills and knowledge – the human capital –  depreciate. If labor compensation is a return on human capital, depreciated human capital returns lower compensation. In other words, your lifetime wages are permanently set back by a scarring effect, and there have been many studies done to show this effect is real. In fact, even in the “women-friendly” labor market in Sweden, research shows the length of time out of the labor force for parental leave is associated with negative effects on labor market outcomes and career pathways[6]. Let’s hope the scarring is kept to a minimum and more women are quickly reabsorbed into the workforce.


Women-Owned Businesses in New Jersey – A Brief Look at the Landscape

This section provides a basic overview of the data on women-owned businesses in New Jersey. Based on the most recent data available, there are approximately 300,000 businesses in New Jersey owned by women.[7] This is the sum of women-owned businesses with and without employees (known as “employer”and“non-employer”firms,respectively).

The data show women-owned firms make up about 18 percent of all employer firms and about 38 percent of non-employer firms. Both shares have increased over the past 10 years. In 2007, 15 percent of all employer firms and 31 percent of all non-employer firms in New Jersey were women-owned.


Clearly, women ownership has a larger stake in the nonemployee landscape. And there are some standout industries. For example, as seen in Table 2, women own more than 50 percent of all non-employer firms in health care and social assistance, educational services, and administrative and support services. Within the employer firm landscape, women own the greatest share of firms in educational services (36 percent).

Table 1 – Women-owned Employer Firms


Industry

Number of Women-Owned Employer Firms

Women-Owner Share of Firms in the Industry

Total for all sectors

34,130

18.20%

Health care and social assistance

5,401

24.80%

Professional, scientific, and technical services

5,132

19.20%

Other services (except public administration)

4,582

30.90%

Retail trade

4,219

18.80%

Accommodation and food services

3,728

19.50%

Administrative and support and waste management and remediation services

1,874

16.20%

Construction

1,832

8.40%

Educational services

1,344

35.90%

Real estate and rental and leasing

923

12.60%

Manufacturing

912

13.00%

Transportation and warehousing

822

12.40%

Arts, entertainment, and recreation

743

22.40%

Finance and insurance

662

10.50%

Information

303

14.70%

Industries not classified

44

15.80%

Management of companies and enterprises

27

3.60%


Table 2 – Women-owned Non-employer Firms

Industry

Number of Women-Owned Non-Employer Firms

Women-Owner Share of Firms in the Industry

Total for all sectors

266,000

37.80%

Professional, scientific, and technical services

44,000

37.90%

Other services (except public administration)

39,000

51.00%

Health care and social assistance

37,500

70.80%

Real Estate and rental and leasing

29,000

29.00%

Retail Trade

25,000

49.50%

Administrative and support and waste management and remediation services

25,000

55.60%

Educational services

15,000

60.00%

Arts, entertainment, and recreation

14,500

37.70%

Transportation and warehousing

13,500

17.00%

Finance and Insurance

5,300

23.00%

Construction

4,700

8.60%

Accommodation and food services

4,700

44.80%

Wholesale Trade

3,500

26.90%

Information

3,300

31.40%

Manufacturing

2,000

31.30%

Agriculture, forestry, fishing, and hunting

400

20.00%

Utilities

70

17.50%


Key Indices for Gender Inequality Globally

Gender gaps manifest themselves in a wide range of measures well beyond those concerning economic inequality. Other ways to view such gaps include political representation, healthcare, education, and societal issues, to name a few. Dealing with such a wide array of variables can be somewhat overwhelming, which is why many institutions create indices to organize multiple factors and simplify them in the form of a single score. Here we are looking at the United Nation’s Global Inequality Index (GII) and the World Economic Forum’s Global Gender Gap Index (GGI) to see two examples of how gender inequality is measured and where the United States ranks.

United Nations Gender Inequality Index (GII)

US Metrics

U.S. Rank

(out of 162)

United States’ Overall Rank

46th

Maternal Mortality Ratio (deaths per 100,000 live births) (2017)

19

56th

Adolescent Birth Rate (2015-2020)

19.9

57th

Percent of Seats held by Women in Parliament (2019)

23.7

66th

Percent of prime-age population with at least some secondary education (2015-2019)

96.1

20th

Labor Force Participation Rate (%) (2019)

56.1

64th


World Economic Forums’

Gender Gap Index Factors (GGI)

U.S Rank

(out of 153)

Overall Rank

53rd

Economic Participation

26th

Educational Attainment

34th

Health and Survival

70th

Political Empowerment

86th

The UN’s GII ranks 162 countries on five distinct measures of gender equality: infant mortality, adolescent birth rate, seats held by women in parliament, the percentage of women with some secondary education, and the labor force participation rate. The United States has an overall ranking of 46th out of 162 countries. The US would fall lower were it not for the US’s secondary education rate ranking 20th. The World Economic Forum’s (WEF) GGI is designed to account for gender disparities in economic participation, educational attainment, health and survival, and political empowerment. On this measure, United States ranks 53rd out of 153 countries. Where the US shows considerable weakness is in health and survival, and political empowerment. Since the last time the GGI was published in 2018, the United States ranking fell by two places, caused primarily by a decline in labor force participation. The WEF emphasizes that the 21.7 percent non-male executive participation rate and the 23.7 percent non-male parliamentary participation rate are critical factors in improving the United States’ gender gap in the future.

It is evident through both of these indices that the United States is lagging on the global stage in multiple gender measures. A focus on economics, healthcare, and education is essential to acknowledging and solving the problem that women and non-binary individuals face in our country.

[1] Measured at a 3-month moving average to reduce month-to-month noise in the data

[2] Lofton, Olivia, Nicolas Petrosky-Nadeau, Lily Seitelman. “Parents in a Pandemic Labor Market,” Federal Reserve Bank of San Francisco Working Paper 2021-04. https://doi.org/10.24148/wp2021-04

[3] Zamarro, Gema and Maria Jose Prados, “Update on Gender Differences in the Impact of COVID-19,” CESR report, University of Southern California December 2020.

[4] Mongey, Simon, Laura Pilossoph, and Alex Weinberg, “Which Workers Bear the Burden of Social Distancing Policies?,” Working Paper 27085, National Bureau of Economic Research May 2020.

[5] Alon, Titan, Matthias Doepke, Jan Olmstead-Rumsey, and Michele Tertilt, “The Impact of COVID-19 on Gender Equality,” Covid Economics: Vetted and Real-Time Papers, 2020, 4.

[6] Aisenbrey, S., M. Evertsson, & D. Grunow. “Is There a Career Penalty for Mothers’ Time Out? A Comparison of Germany, Sweden and the United States.” Social Forces, 88(2), 573-605, 2009.

[7] 2018 Annual Business Survey; 2017 Nonemployer Statistics by Demographics.

Indicator 1 – NJ Housing Market – A Surge in Sales Leads Jump in Prices

Source: New Jersey Association of Realtors (NJAR)

To an economist, housing is like any other market: it’s about supply and demand. And while demand for New Jersey homes has swelled, supply has done quite the opposite. And, as a result, prices have surged higher.

Pending sales is the best leading indicator of housing demand. Pending sales track home sale contract signings, which generally occur one to two months before the sale is officially recorded. Pending home sales surged during the second half of 2020, up approximately 40 percent compared to 2019.

Why has demand surged? The sharp drop in mortgage rates, which increased buying power in the housing market, is a probable factor. But there were also some clear behavioral changes produced by COVID-19, including more households relocating from nearby urban areas into New Jersey.

With increasing demand and no commensurate rise in supply, house prices increased a lot. According to the New Jersey Association of Realtors (NJAR), the median sale price in 2020Q4 was around $375,000, up 20 percent from approximately $310,000 in 2019Q4. It is important to note that this data only reflects the prices of homes that were sold, meaning the value of all homes may not have increased that much. However, the data shows median prices rose across all New Jersey counties, suggesting there has been an actual increase in home prices.

It is possible these price increases will encourage more people to sell their homes because prices are signals to the market. We saw an example of this early in the pandemic, when increased demand for masks drove up the price and many clothing companies began producing their own cloth facemasks. In the housing market, a rise in prices clearing the market might induce someone who was not otherwise thinking of selling their house – someone on the “margin” — to put it up for sale.

But what if homeowners now value their homes more highly than they did before? In that case, the rise in prices might not induce many more people to put their homes up for sale because the price hasn’t risen enough. In essence, the margin has shifted. One can make a good argument that this is exactly what is happening now in New Jersey, as the supply of homes for sale remains exceptionally low relative to demand. A good indicator of the balance between supply and demand is depicted in the chart on the right, which shows Months Supply of Inventory (MSI), which indicates of how many months it would take to clear all supply given the current pace of home sales. In December, new listings in 2020 were down 8.6 percent versus 2019, and the MSI of homes was at an all-time low of 2.2. This suggests prices might need to increase even more before we will see more homes put up for sale.

Of course, there is another obvious way to increase the housing supply: building more homes! It is certainly conceivable the rise in prices will induce home builders to produce more homes, and in recent months there has been a jump in the level of housing building permits issued.

In sum, demand for housing remains strong even as home prices have risen significantly. In order for the demand jump to induce a supply response, prices will have to rise more than they already have. At some point, construction of new homes will likely help fill that gap.

Indicator 2 – Estimated Jobs Created in NJ by Greenfield Foreign Direct Investment

Throughout 2020, nearly every aspect of the international markets took a hit, and Foreign Direct Investment (FDI) was no exception. With so much uncertainty surrounding a post-pandemic economy, it was clear the pace of FDI would slip. Still, many foreign companies announced Greenfield[1] Projects in New Jersey throughout 2020.

According to fDi Markets, foreign investors in 2020 announced 32 projects in New Jersey, which will result in an estimated $1.5 billion  in capital expenditures and an estimated 2,120 jobs. A total of 15 countries announced New Jersey projects in 2020, with Canada and the United Kingdom tying for most projects created at six, and Germany topping the rankings for most jobs at an estimated 446. Many of Germany’s projects were in the food & beverage sector, which makes up a considerable portion of jobs created. This amount of jobs stemming from retail indicates many international organizations are confident enough in New Jersey’s broad consumer market to keep expanding brick and mortar stores in the face of a pandemic. 

Investments went into a variety of sectors, including pharmaceuticals, renewable energy, and biotechnology. One of the largest investing companies for 2020 announced two solar plants in Woodbine and another in South Brunswick, resulting in an estimated $643 million in capital expenditures. These investment projects show a definitive sign that many international organizations see New Jersey as a go-to hub for commercial and consumer investment, even during times of global economic and public health uncertainty.

Indicator 3 – Gross Domestic Product by County

The Bureau of Economic Analysis releases figures on Gross Domestic Product (GDP) by county every year. Most recently, data was released for 2019. Following is a brief analysis of county GDP in New Jersey from 2006 – 2019  focused on real GDP, which is adjusted for inflation.

The largest industry statewide and in many counties in 2019 was finance, insurance, and real estate (20 percent statewide). Other industries topping the list in individual counties included professional and business services (18 percent), manufacturing (9 percent), and government (10 percent). As can be seen in Table 1, a majority of the largest industries in 2006 remained the largest contributors to county GDP in 2019. In addition, for the counties where the largest industry remained the same from 2006-2019, those industries saw minimal change in their contribution to county GDP. One exception was Hudson County, which saw a 10 percentage point drop in the share of GDP contributed by finance, insurance, and real estate. This drop was filled by a nine percentage point increase in professional and business services – an industry group that thrived in Hudson County.

Table 2 reports the industries that grew the most in New Jersey’s counties between 2006 and 2019 for which the industry accounts for at least two percent of the county’s GDP. Fastest statewide growth rates were recorded by information and professional and business services. Overall, there was a wide array of industries posting strong growth rates, including transportation and warehousing, utilities, educational services, health care, and social assistance. Some of NJ’s counties did see dramatic growth in industries such as Agriculture, Forestry, Fishing, and Hunting and also Mining, Quarrying, and Oil and Gas extraction. However, generally those industries make up a very small contribution to county GDP across the state and therefore are not included in the below table.

Table 1: Largest Major Industry Share of GDP

NJ County

2006 Largest Industry Share

2019 Largest Industry Share

Statewide

Finance, Insurance, Real estate (23%)

Finance, Insurance, Real estate (20%)

Atlantic

Arts, entertainment, recreation, accommodation, and food services (31%)

Finance, Insurance, Real estate (20%)

Bergen

Finance, Insurance, Real estate (21%)

Finance, Insurance, Real estate (17%)

Burlington

Finance, Insurance, Real estate (25%)

Finance, Insurance, Real estate (21%)

Camden

Finance, Insurance, Real estate (23%)

Finance, Insurance, Real estate (21%)

Cape May

Finance, Insurance, Real estate (36%)

Finance, Insurance, Real estate (37%)

Cumberland

Government (20%)

Government (18%)

Essex

Finance, Insurance, Real estate (26%)

Finance, Insurance, Real estate (24%)

Gloucester

Manufacturing (22%)

Manufacturing (21%)

Hudson

Finance, Insurance, Real estate (43%)

Finance, Insurance, Real estate (33%)

Hunterdon

Professional & Business Services (20%)

Finance, Insurance, Real estate (23%)

Mercer

Finance, Insurance, Real estate (20%)

Professional & Business Services (22%)

Middlesex

Finance, Insurance, Real estate (20%)

Professional & Business Services (22%)

Monmouth

Finance, Insurance, Real estate (22%)

Finance, Insurance, Real estate (20%)

Morris

Finance, Insurance, Real estate (21%)

Professional & Business Services (30%)

Ocean

Finance, Insurance, Real estate (27%)

Finance, Insurance, Real estate (25%)

Passaic

Finance, Insurance, Real estate (23%)

Finance, Insurance, Real estate (21%)

Salem

Utilities (49%)

Utilities (54%)

Somerset

Manufacturing (24%)

Professional & Business Services (25%)

Sussex

Finance, Insurance, Real estate (23%)

Finance, Insurance, Real estate (23%)

Union

Manufacturing (21%)

Manufacturing (19%)

Warren

Manufacturing (27%)

Finance, Insurance, Real estate (19%)

Table 2: Industry Growth for industries at least 2% of regional GDP (state & county)

Area

Most Growth

(Percent growth between 2006-2019)

2nd Most Growth

(Percent growth between 2006-2019)

New Jersey

Information (46%)

Professional & Business Services (42%)

Atlantic

Professional & Business Services (31%)

Educational services, health care, and social assistance (25%)

Bergen

Information (38%)

Educational services, health care, and social assistance (29%)

Burlington

Information (168%)

Educational services, health care, and social assistance (48%)

Camden

Arts, entertainment, recreation, accommodation, and food services (31.5%)

Educational services, health care, and social assistance (31%)

Cape May

Manufacturing (96%)

Wholesale Trade (27%)

Cumberland

Agriculture, forestry, fishing and hunting (68%)

Wholesale Trade (40%)

Essex

Utilities (129%)

Transportation & Warehousing (48%)

Gloucester

Utilities (155%)

Transportation & Warehousing (99%)

Hudson

Professional & Business Services (140%)

Information (112%)

Hunterdon

Information (105%)

Educational services, health care, and social assistance (27%)

Mercer

Transportation & Warehousing (107%)

Wholesale Trade (82%)

Middlesex

Utilities (267%)

Transportation & Warehousing (60%)

Monmouth

Information (41%)

Educational services, health care, and social assistance (37%)

Morris

Professional & Business Services (75%)

Educational services, health care, and social assistance (42%)

Ocean

Professional & Business Services (64%)

Educational services, health care, and social assistance (30%)

Passaic

Educational services, health care, and social assistance (22%)

NA

Salem

Transportation & Warehousing (73%)

Educational services, health care, and social assistance (6%)

Somerset

Information (85%)

Professional & Business Services (57%)

Sussex

Manufacturing (107%)

Transportation & Warehousing (5%)

Union

Utilities (48%)

Professional & Business Services (38%)

Warren

Professional & Business Services (126.3%)

Information (16%)


[1] Greenfield FDI is an investment that occurs when a foreign company invests in a brand-new foreign project, versus something like M&A.

Indicator 1 – New Jersey Private-Sector Gross State Product (GDP)

0125GDP.jpg

Source: Bureau of Economic Analysis

As with every state in the US, New Jersey’s economy suffered an unprecedented drop in 2020:Q2, followed by an unprecedented rebound in 2020:Q3.

Heading into Q2, with COVID-19 cases surging, New Jersey’s economy went into a virtual freeze – something with no parallel in post-WWII history. Thanks to successful efforts in the state to “flatten the curve” and a huge fiscal spending surge to support businesses and households, the economy stabilized in Q2, setting the stage for a substantial rebound in Q3.

Gross state product (GSP) – how we measure the level of economic activity for any defined period – shows New Jersey’s economy dropped at a breakneck 37 percent annualized pace in Q2. To put that decline in perspective, the next sharpest decline in New Jersey’s GSP over the past 20 years was a -9.7% annualized drop in 2008:Q4 – an undoubtedly terrible time for the economy. This latest drop was four times the magnitude of that decline.

Fortunately, the combination of economic stimulus, financial supports, and success in slowing the pace of COVID-19 infection enabled New Jersey’s economy to snap back in Q3, jumping at an incredible 41 percent annualized pace. However, even with this growth, at the end of the third quarter, New Jersey’s economy was still operating four to five percent below capacity (see difference between Q3 GDP and the GDP trend in Q3).

Of course, this is not just the case in New Jersey – the economy for the US in total is performing well below its capacity. The economy operating this far below its capacity – the gap – is a big problem. There is an empirical relationship between the size of the economy’s gap and the unemployment rate. What we have seen in recent history is a gap of four to five percent is in line with an unemployment rate of seven to eight percent. And the longer it takes to narrow and close this gap, the greater the chance of people remaining unemployed for a long period and becoming less employable. This is due to the fact that, the longer people remain unemployed, the more labor market skills they lose, causing them to be shunned by potential employers. This can also lead to people becoming discouraged to the point that they quit looking for work. That said, we expect the mix of government stimulus and effective vaccination programs get the economy to surge in 2021. Government stimulus will not only provide support to the economy during the recent COVID-19 resurgence but also provide a substantial tailwind to the economy as more people get vaccinated and more of the economy reopens. This should quickly narrow the current economic gap and get people back to work.

Indicators 2 and 3 – New Jersey Goods Trade Flows 

0125TradeFlows_left-(1).jpg 0125TradeFlows_right-(1).jpg

Source: Bureau of the Census

As with all economic shocks, the effect of the pandemic on the economy has not been even across sectors. From where we sit now, almost a year following the initial shock, it is apparent the pandemic has had a bigger impact on face-to-face services than on goods production. That said, production and goods trade have been squeezed.

Since the beginning of the 2020, there has been a scramble among analysts to find data sources that best encompass the economic impact of the pandemic on supply chains, and no metric paints a clearer picture than total trade. Many believed that total trade would take a large hit due to the interruption of supply chains caused by closures, and the data soon backed up these claims.

The figures above show the mapping of the total trade of goods in New Jersey for 2019 and 2020, which illustrate the effect of COVID’s supply-shock and our road to recovery. From February 2020 to May 2020, total trade of goods dropped 32 percent to its lowest point: $9.8 billion. Since then, there has been an increase in total trade for five consecutive months which surpassed New Jersey’s figures for the month of October 2019 by $540M and narrowed our gap from last year’s total to $12.9B. With the worst out of the way and the damage apparent, suppliers are now looking toward the future to recoup their losses and get back on track.

Indicators 4 and 5 – New Jersey Office Leasing Activity and Vacancy Rate

0125officeleasing_left-(1).jpg 0125officeleasing_right-(1).jpg

Source: CoStar

The office and retail Commercial Real Estate (CRE) markets in New Jersey were dealt a significant blow by the pandemic. Unlike the industrial market, which has not only weathered COVID-19 but even benefitted from it in some instances, government shutdowns and social-distancing practices resulted in a sharp downturn in retail and office CRE in 2020.

Prior to the pandemic, New Jersey’s office market appeared well-positioned for steady growth entering 2020. Vacancy rates in 2018 and 2019 were steady, and rents had been rising. Leasing activity had fluctuated over the prior 10 years but remained between 3M-4M sq. ft. per quarter. As seen in the chart below, COVID-19 put an end to that trend. The amount of square footage leased in 2020:Q2-2020:Q4 was 44% percent below the prior five-year average. Office vacancy rates shot higher, from around 19 percent in 2019 to above 23 percent at the end of 2020.

Indicators 6 and 7 – New Jersey Retail Leasing Activity and Vacancy Rate

0125leasing_left.jpg 0125leasing_right.jpg

 Source: CoStar

Despite the frequent commentary that e-commerce is destroying brick-and-mortar retail, retail markets in New Jersey through 2019 had been seeing some growth. Prior to the pandemic, vacancy rates had dropped statewide to 4.5 percent. The chart above shows the recent history of statewide retail vacancy rates from 2007-2021. The expectation is that vacancy will decline as businesses are allowed to reopen and operate at full capacity. The number of direct leasing deals also saw a notable decrease, especially in 2020:Q2. However, deals increased in Q3 and Q4, a positive sign for retail’s recovery from the pandemic.