Please be advised that a telephonic meeting of the New Jersey Economic Development Authority is scheduled for 10:00 AM, Wednesday, October 13, 2021.

The Members will convene to via conference call only.  Members of the public may participate in the meeting by calling in on the conference line.  Members of the public will have an opportunity to speak during the public comment segment of the meeting.

The following conference number is being provided:

CONFERENCE NAME: NJEDA BOARD MEETING (October 13, 2021)

PARTICIPANT DIAL-IN NUMBER: 877-692-8955

PARTICIPANT ACCESS CODE: 4204420

Members of the public are encouraged to call in prior to the time the meeting is scheduled to begin to avoid any delays. 

The agenda can be found 48 hours prior to the meeting on our website: https://www.njeda.gov. The meeting will also be recorded and posted to the NJEDA website shortly after the conclusion of the meeting.

NOTICE OF SPECIAL TELEPHONIC MEETING

A Special Telephonic Meeting of the New Jersey Economic Development Authority is scheduled for 11:00 am, Wednesday, September 8, 2021.  The Members will convene via conference call only, to discuss and vote upon emergency small business support measures, which may include, but is not limited to, the creation of a new financial assistance grant program for small businesses impacted by Tropical Storm Ida and associated delegated authority to staff for program administration.

Members of the public may participate in the meeting by calling in on the conference line.  Members of the public will have an opportunity to speak during the public comment segment of the meeting. The following conference number is being provided:

MEETING NAME: NJEDA BOARD MEETING (SEPTEMBER 8, 2021)

PARTICIPANT DIAL-IN NUMBER: 1-877-692-8955

PARTICIPANT ACCESS CODE 1313977

Members of the public are encouraged to call in prior to the time the meeting is scheduled to begin to avoid any delays. 

The agenda can be found 48 hours prior to the meeting at our website: www.njeda.gov.

The next Capital City Redevelopment Corporation Board meeting is scheduled for 11:00 am on Friday, May 21, 2021, via teleconference only.

Members of the public whom wish to speak during the public comment segment of the meeting, pertaining to agenda items, may call into the meeting by using the following conference number:

Teleconference #:

+1 551-220-2262  

Conference ID: 510 746 889 #

The agenda can be found 48 hours prior to the meeting at our website: www.njeda.gov/ccrc

Economists love their data, and for good reason. Data enables us to understand important issues such as what factors support economic growth, impact price inflation, and alter labor flows. Right now, many people are struggling to use data to answer one very important question: is overgenerous government support for unemployed workers hindering businesses from recruiting the employees they need to recover from the COVID-19 pandemic? Today’s Economist’s Corner examines what the data has to say about this, and shows why this common, seemingly-intuitive explanation for why businesses are struggling to recruit workers likely doesn’t tell the real story.

There is a persistent narrative that unemployment insurance benefits are too generous, which is lowering the incentive of people to seek employment. At first glance, this could make intuitive sense. Currently, we are seeing a surge in job openings, most notably for jobs requiring relatively low levels of education. But at the same time small businesses are having an historically hard time filing open positions. Normally, with such high unemployment, small businesses would be having a relatively easy time finding willing workers. After all, a high unemployment rate means there is a considerably higher supply of people willing to work then there is demand for those workers. Thus, the evidence would seem to suggest the need to reduce unemployment insurance in order to get people back to work.

However, this simple explanation misses a few key pieces of data. This article addresses the problems with this narrative and suggests some alternative explanations that better fit the data and offer reasons for optimism, but before we can get into that, we need to get on the same page regarding the data that we’ll be examining.

The main way macroeconomists measure economic growth is GDP, which measures the income generated by the mix of land, labor, capital, materials, and technological progress. As for the labor markets, there are many ways to measure it. Probably most often used is the unemployment rate, which estimates the share of people in the labor market looking for a job but currently without one.

Macroeconomists also use data to examine the relationships between concepts, such as how economic growth impacts inflation and supply and demand for workers. One of the key relationships is that between economic growth and the state of the labor market. The idea that there should be a relationship between economic growth and the labor market is easy to understand – labor is a key input to economic production, so as pressure grows on the economy to expand, demand for labor should increase.

One of the best ways we have to examine this relationship is comparing the unemployment rate to what is known as the GDP gap, which estimates the difference between where GDP is and where it could be if it were running at its full potential. Think of it this way – imagine a factory running at 70% of its capacity. It has enough unused machine time to produce 30% more than what it is actually doing without having to hire more people or invest in more machinery, which is a gap between actual and potential output. Just apply that concept to the economy and you have a basic understanding of the GDP gap.

Furthermore, it makes sense that this gap would be related to the unemployment rate – an unemployment rate is, essentially, a gap in labor utilization. If the unemployment rate is at 10 percent, it means 10 percent of people who would like to be employed are not – that’s a gap. And a gap in the economy should be reflected in a gap in labor supply versus demand.

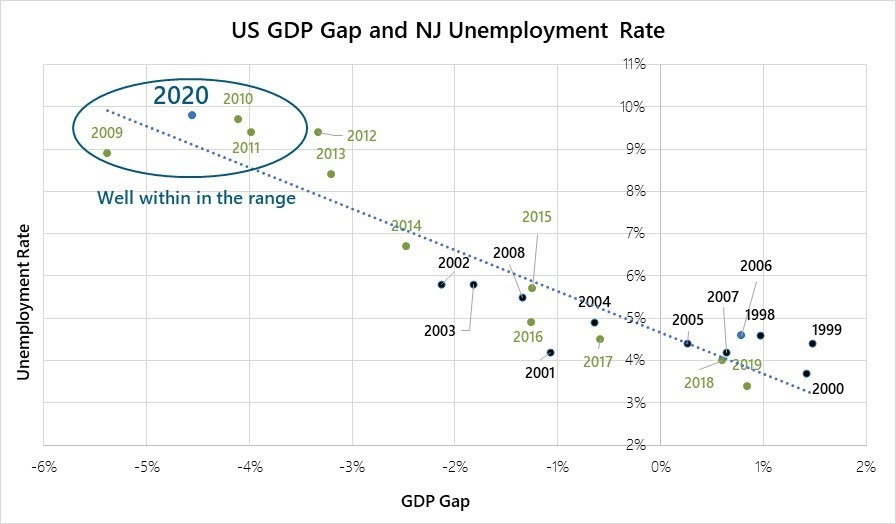
The following chart shows the relationship between the unemployment rate and the US GDP gap for New Jersey. On the chart, the unemployment rate is tracked on the y-axis and the GDP gap is tracked on the x-axis (the bottom axis). The chart shows two main things. For one, every point indicates where the unemployment rate and GDP gap were for that year. For example, in 2011, the NJ unemployment rate was 9.4 percent and the US GDP gap was -4.0 percent. The chart shows another thing – the relationship between the unemployment rate and the GDP gap. A larger (more negative) gap is associated with a higher unemployment rate. The dotted line shows the line that is the best fit for all the points. As can be seen, the data for 2020 was very close to what would be expected given the linear model fit. In sum, there is nothing strange about the 2020 level of the unemployment rate given the level of the GDP gap.

Now you might be thinking, “OK, that’s great mister economist, the unemployment rate is in line with where the GDP gap says it should be, but why are you telling me all of this?” Well, there is a reason, and it has to do with unemployment insurance.

Contrary to the argument that unemployment insurance is keeping people from taking available jobs, this chart suggests unemployment insurance is not the driving factor keeping people out of jobs. When a person is collecting unemployment insurance, that person should be officially classified as unemployed. Thus, if there were an extraordinary amount of people who were choosing to remain unemployed because of the incentive to do so, the unemployment rate would be considerably higher than what you would expect given the GDP gap. And that is not the case – the unemployment rate is right where it should be. Thus, there is no good evidence to suggest that unemployment insurance is incentivizing people to remain unemployed.

Ok, so unemployment insurance isn’t the problem. Then what is? Evidence suggests there are other disincentives aside from unemployment insurance keeping people from taking available jobs right now. Two immediately come to mind:

  1. A lack of child care remains an intractable issue.
  2. We are still in a pandemic.

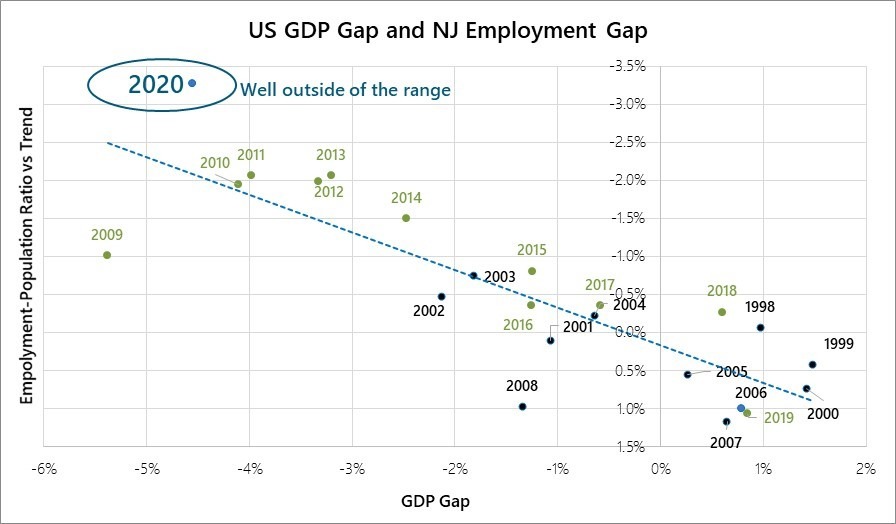
To start examining these issues, it is worthwhile to look at a measure of the labor market gap that is more comprehensive than just unemployment, because one thing the unemployment rate does not capture is people who are not employed and not actively looking for employment. These are people who are out of the labor market, and as it turns out there has been a huge surge of people in 2020 who left the labor market. To capture this dynamic, a better measure of the labor market gap is the difference in employment-to-population ratio versus its trend. Employment-to-population is the share of the adult population that is employed. If a person leaves New Jersey’s labor market but remains a resident of New Jersey, that person is still counted in the denominator – population – so it better reflects all changes in labor market supply and demand. This labor market gap measure is depicted in the chart below relative to the GDP Gap.

As the chart shows, this measure of the labor market gap is beyond what would be expected given the GDP gap. Thus, there is evidence to suggest more people left the labor market in 2020 than would be expected.

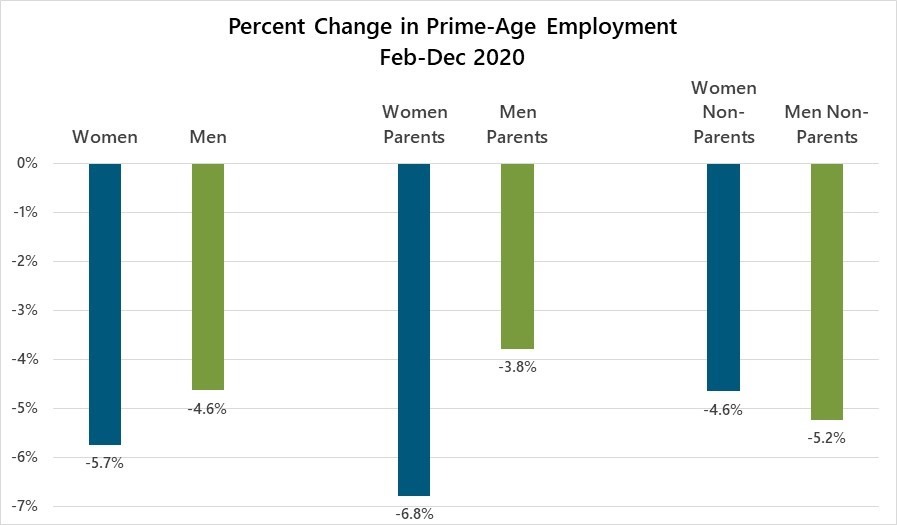
So, why would so many people have chosen to outright leave the labor market? A conceivable driver is that a lack of child care is holding people – especially women – back from reentering the labor market. The following chart was produced for our previous issue of the Economist’s Corner. It shows prime-age women’s employment has dropped considerably more that of men.

Further delving into the data shows that the intersection of gender and parenthood is where the dichotomy occurs. Female parent employment fell 6.8 percent through December, 2020, which is a much larger decline than the 3.8 percent drop recorded for male parent employment. The evidence suggests that this dichotomy results from female parents shouldering a larger share of child care responsibility than male parents. Thus, when child care, including education, essentially shut down, so did female parent labor market participation.

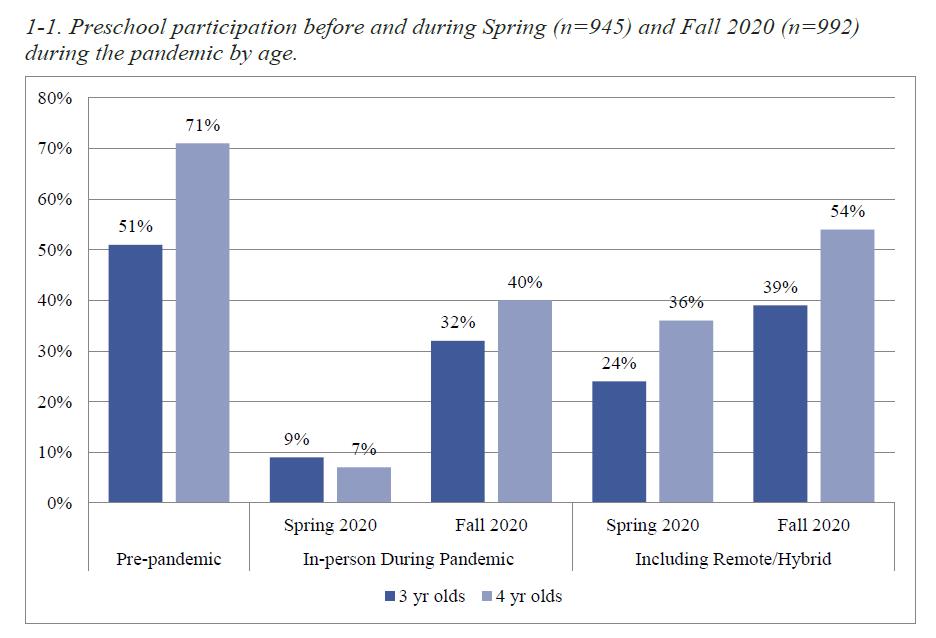
This next chart is a reproduction from a recent National Institute of Early Education Research publication showing preschool participation rates before the pandemic, in spring 2020, and in fall 2020. Whereas 71 percent of four-year-old children were enrolled in preschool pre-pandemic, that share plummeted to 7 percent in spring and recovered somewhat to 40 percent by fall. Drops of similar magnitude were reported for three-year-old children.

Applying absolute numbers to those percentage changes, as of 2018 there were 4.4 million three- and four-year-old children enrolled in preschool. A drop of 30 percentage points in enrollment share of population would mean approximately 1.8 million fewer three- and four-year-old children enrolled. Apply New Jersey’s share of the US population to those numbers, and we have approximately 55,000 fewer New Jersey three- and four-year-old children enrolled in preschool. If each of those children at home yielded a mother out of the labor force, that alone could account for 1/3 of the drop in New Jersey’s participation rate. And that’s not even considering other child care and educational sources for other age children.

The bottom line – child care has likely been a big reason why labor supply is so slow to recover, even as demand for workers is surging.

Source: Barnett, W.S., & Jung, K. (2021). Seven Impacts of the Pandemic on Young Children and their Parents: Initial Findings from NIEER’s December 2020 Preschool Learning Activities Survey. New Brunswick, NJ: National Institute for Early Education Research.

In addition to child care keeping parents, and especially mothers and other female caregivers, out of the labor force, labor force participation is also certainly down due to the simple fact that we remain in the midst of a deadly pandemic. At this point, approximately 51 percent of New Jersey’s population has received one or two vaccine doses, but that is not near the threshold necessary for herd immunity and many people are understandably hesitant to return to work in this context, especially in jobs that require in-person interaction.

Taken together, this evidence suggests that, even with no change to unemployment insurance, as more people receive vaccines and schools and daycares reopen to full capacity, it will become easier for businesses to fill open positions. However, there remains the underlying risk that structural damage has occurred in the child care industry with child care centers and home-based businesses closing due to the pandemic, lowering the supply of child care.

It is encouraging that help is on the way via a mix of organic economic growth, continued monetary stimulus, and a new fiscal package aimed at providing support to both working and unemployed mothers. The State has undertaken a number of initiatives to support the child care sector and families in need of child care assistance in this critical moment, including increased investments in child care, waiving parent co-pays in the State’s child care subsidy program, offering grants to child care providers, and providing tuition support for school-aged supervision. For its part, the NJEDA currently has $20 million in grants to provide to small child care businesses (with fewer than 50 full-time equivalent employees). Furthermore, the federal government’s American Rescue Plan will provide New Jersey approximately $267 million in child care assistance to parents and caregivers and approximately $428 million in funds to child care providers. Thus, a substantial amount of resources is being focused on supporting the child care industry. But until these issues are remedied, it is likely businesses will continue finding it hard to recruit the labor they so sorely need.

Notice of Funding Availability: Applications now available.

BACKGROUND ON SMALL AND MICRO BUSINESS PPE NEEDS

The NJ Small and Micro Business PPE Access Program was developed in response to consistent concerns emerging from the Governor’s Restart and Recovery Commission, the nine sector-based committees of the Governor’s Restart and Recovery Advisory Council and input from numerous small and micro businesses. Both the Commission and the Advisory Council highlighted the need for readily available, priced PPE to accelerate economic recovery.  As small and micro businesses and organizations in historically underserved communities are particularly vulnerable to being crowded out of essential goods when tight market conditions occur, a key consideration of the program has been the need to ensure equitable distribution and pricing of PPE.

More than one third of all New Jersey workers are employed by organizations of 100 employees or fewer. Many of these companies do not have the reach or the resources to obtain goods outside of their normal retail buying channels, particularly in times of significant supply/demand imbalances. PPE falls squarely into the category of a good that was not essential to many of these organizations before the COVID-19 outbreak but is critical today.


PROGRAM PURPOSE

Overall Program

The NJ Small and Micro Business PPE Access Program is designed to make fairly priced PPE more easily available to all the small and micro businesses and non-profit organizations in the state, to prevent the spread of the COVID-19 and reduce their burden of sourcing for the PPEs from the competitive markets. In addition to the above the program will:

  1. Facilitate the State’s economic recovery by ensuring that small and micro businesses and non-profit organizations – the customers – can access affordably priced PPE and other safeguarding equipment to protect their employees as they return to work and continue to operate in a COVID-19 environment;
  2. Ensure small and micro businesses and non-profit organizations have access to the information they need to select the appropriate PPE needed for their context;
  3. Ensure that businesses in historically underserved communities are particularly able to access affordable PPE; and
  4. Support the State’s manufacturing sector by providing an offsetting subsidy for purchases of PPE manufactured or assembled at a manufacturing facility in New Jersey.

The Phase 1 Program – Selecting Designated Vendors and Sourcing PPE from NJ Companies

On August 11, 2020, NJEDA approved Phase 1 of the PPE Access Program. The focus of Phase 1 has been to identify and designate qualified vendors to launch online platforms where NJ companies can buy PPE at fair prices from reliable vendors offering a curated array of quality products all at a discount to normal market prices.  Within the Program, these vendors are called “Designated Vendors” (DVs).  Small and micro businesses will access Designated Vendors’ online platforms via a PPE Access Program website hosted on the State’s COVID19.nj.gov site (https://covid19.nj.gov/ppeaccess).  Small businesses will also be able to learn about workplace PPE best practices and use a simple tool to determine their PPE needs.

In addition, Phase 1 includes an economic development component to encourage the Designated Vendors to make wholesale purchases of PPE from NJ manufacturers and from small distributors located in traditionally underserved NJ communities.  To support this aim, the NJEDA approved the creation of a $3.5 million grant pool to be used as subsidies to bridge potential pricing gaps between NJ manufacturers and distributors and the global market.

The Phase 2 Program – Providing Purchase Subsidies to Benefit Small and Micro Businesses

Based on the response received from DVs of varying types and sizes, the program was expanded by launching a second Phase, aimed at providing purchase subsidies through DVs to benefit the State’s small businesses with a focus on those located in historically underserved communities.

As part of Phase 2, on October 14, 2020, NJEDA approved a grant pool of $20.4 million for purchase price discounts of 25% through Designated Vendors to small and micro businesses.  The subsidized discount  had an initial cap of $400 per organization generally and $500 for organizations located in historically underserved communities (i.e., located in one of New Jersey’s 715 Opportunity Zone Eligible census tracts).  Companies eligible to benefit from these subsidies are determined by company size (based on full-time equivalent (“FTE”) employment) and location, as described more fully below.

Under paragraph 6(a) of the Request of the Members in the October 14, 2020 Board memo, the CEO was given the delegated authority to make changes to “extend internal program deadlines,” and under paragraph 6(b), he has the delegated the authority to “adjust per round small business coupon/discount values,” based upon program demand.

Based on initial experience of the Program’s second phase, Staff requested changes that substantially increased the level of program participation and ensured wider availability of essential PPE for New Jersey small businesses. The requested changes took effect on Tuesday, November 24, 2020. These changes:

The initial Phase 2 of the program ended on December 31, 2020.  Under his delegated authority to extend internal program deadlines, the CEO has granted an additional extension of the PPE Access program Phase 2 until no later than June 30, 2021.  

PROGRAM STRUCTURE AND ELIGIBILITY

Benefits through the Program

Phase 2 of the extended PPE Access Program has been structured to provide $2.5 million of grant funding

to cover 65% of eligible small businesses’ or non-profits’ PPE purchases through the Designated Vendors PPE Access Program sites. The 65% discount is capped per organization, per round of the Program, at $800 generally, and $1,000 for organizations in opportunity zone eligible census tracts.  This subsidized discount is in addition to the minimum 10% discount offered by each of the Designated Vendors under Phase 1 of the Program.

Discounts are made available by the Designated Vendors to businesses and non-profits (“Subsidy-Eligible Recipients” or “SERs”) having 100 or fewer FTE employees, based on EDA confirmation of eligibility.  The program eligibility threshold is at 100 FTEs for the following reasons:

A business’s FTE is determined based on its most recent NJ Department of Labor (“DOL”) form “NJ Employer Report of Wages Paid” (WR-30) where available, or, in limited circumstances where NJ DOL data is not available, through company self-certification.

Where possible, Designated Vendors will split the total value of the coupon/discount into multiple coupons/discounts of lower value to enhance flexibility of the program (i.e., allow SERs to split their PPE purchase up over multiple purchases).  The ability to offer that flexibility will be determined by the Designated Vendors’ technical capabilities and may differ by Designated Vendor.

While businesses will have the ability to purchase goods other than PPE from the Designated Vendors, all subsidies under this program will only apply to PPE offered through the Program.

General Program process

To simplify the administration of the grant funding for small businesses and non-profits, funds flow from NJEDA to the Designated Vendors, who provide the benefits to SERs in the form of a coupon/discount to reduce their payment obligations. 

The flow of application, approval and receipt of subsidies occurs as follows:

NJEDA’s determination that a business is eligible for a coupon/discount amount will be subject to continued funding availability.

Coupon/discount reimbursement to Designated Vendors will be made within 30 days after receipt of accounting documentation. To comply with the expenditure requirements of the CARES Act and the MOU with NJ Treasury, the Designated Vendor must document the PPE purchased by each SER and must request NJEDA disbursement from NJEDA no later than June 29, 2021 (or applicable deadline based upon any updated State and Federal CARES Act disbursement requirements).

Eligibility confirmation process

Organizations seeking to qualify as SERs and to benefit from the Phase 2 subsidies will be required to confirm their eligibility on the PPE Access Program website.  While the subsidy is offered through the Designated Vendors, NJEDA will be responsible for eligibility checks to ensure privacy, timeliness and simplicity. 

Eligibility will be determined once per round per EIN (meaning that businesses that utilize one EIN for multiple locations will only be able to access the coupons/discounts once per round).

Eligibility screening will include:

A tax clearance certificate from the New Jersey Department of Treasury’s Division of Taxation will not be required for a small business to benefit from this program.  However, tax clearance certificates continue to be required for the Designated Vendors in the Program.
 

During the eligibility check process, the SER will be required to confirm their correct email address.  SERs will be solely responsible for entering a correct email address; NJEDA will not verify or confirm the email address.

Appeals

Organizations will be able to appeal the Authority’s determination of Phase 2 eligibility within 5 days of notice of the determination.  Appeals will be reviewed by a NJEDA member who has not up until that point been directly involved in the eligibility determination. 

As the Authority is not involved in the actual issuance of the coupon/discount, in the use of the coupon/discount, in the sale of the PPE, the operation or functionality of the DV website, or such other actions or decisions under the DV’s sole control, any attempt to appeal from such actions will be rejected, as they are not a protest of an EDA action or decision. 

Similarly, any attempt to appeal because the SER entered and confirmed an incorrect email address will not be a valid basis for an appeal. Funds will be set aside for the maximum amount of subsidy support for any appeals that are lodged with the Authority. 

Post-eligibility audits

NJEDA will conduct audits to confirm that small business self-certifications provided during the eligibility assessment process were accurate.  In such cases where the audit reveals that a self-certification was not accurate, NJEDA may request that the funds be returned and/or may refer these organizations to the relevant State agency for further investigation.

Funding Disbursement

Disbursements (reimbursements of subsidized discounts) to Designated Vendors from the $2.5 million grant pool will be made up to 30 days after receipt of acceptable Phase 2 documentation.  Designated Vendors must submit request for NJEDA disbursement no later than June 29, 2021 to enable enough time for disbursement.

Additional Information

Additional information on the New Jersey Small and Micro Business PPE Access Program and this grant may be found at: https://covid19.nj.gov/ppeaccess.

Notice of NJEDA Board Meeting

NJEDA – EDA Board Meeting 2/10/2021

Please be advised that a telephonic meeting of the New Jersey Economic Development Authority is scheduled for 10:00 AM, Wednesday, February 10, 2021.

The Members will convene to via conference call only.  Members of the public may participate in the meeting by calling in on the conference line.  Members of the public will have an opportunity to speak during the public comment segment of the meeting. The following conference number is being provided:

CONFERENCE NAME:NJEDA BOARD MEETING (February 10, 2021)
PARTICIPANT DIAL-IN NUMBER877-692-8955
PARTICIPANT ACCESS CODE: 4204420

Members of the public are encouraged to call in prior to the time the meeting is scheduled to begin to avoid any delays. 

The agenda can be found 48 hours prior to the meeting on our website: www.njeda.gov.

Indicator 1 – New Jersey Private-Sector Gross State Product (GDP)

0125GDP.jpg

Source: Bureau of Economic Analysis

As with every state in the US, New Jersey’s economy suffered an unprecedented drop in 2020:Q2, followed by an unprecedented rebound in 2020:Q3.

Heading into Q2, with COVID-19 cases surging, New Jersey’s economy went into a virtual freeze – something with no parallel in post-WWII history. Thanks to successful efforts in the state to “flatten the curve” and a huge fiscal spending surge to support businesses and households, the economy stabilized in Q2, setting the stage for a substantial rebound in Q3.

Gross state product (GSP) – how we measure the level of economic activity for any defined period – shows New Jersey’s economy dropped at a breakneck 37 percent annualized pace in Q2. To put that decline in perspective, the next sharpest decline in New Jersey’s GSP over the past 20 years was a -9.7% annualized drop in 2008:Q4 – an undoubtedly terrible time for the economy. This latest drop was four times the magnitude of that decline.

Fortunately, the combination of economic stimulus, financial supports, and success in slowing the pace of COVID-19 infection enabled New Jersey’s economy to snap back in Q3, jumping at an incredible 41 percent annualized pace. However, even with this growth, at the end of the third quarter, New Jersey’s economy was still operating four to five percent below capacity (see difference between Q3 GDP and the GDP trend in Q3).

Of course, this is not just the case in New Jersey – the economy for the US in total is performing well below its capacity. The economy operating this far below its capacity – the gap – is a big problem. There is an empirical relationship between the size of the economy’s gap and the unemployment rate. What we have seen in recent history is a gap of four to five percent is in line with an unemployment rate of seven to eight percent. And the longer it takes to narrow and close this gap, the greater the chance of people remaining unemployed for a long period and becoming less employable. This is due to the fact that, the longer people remain unemployed, the more labor market skills they lose, causing them to be shunned by potential employers. This can also lead to people becoming discouraged to the point that they quit looking for work. That said, we expect the mix of government stimulus and effective vaccination programs get the economy to surge in 2021. Government stimulus will not only provide support to the economy during the recent COVID-19 resurgence but also provide a substantial tailwind to the economy as more people get vaccinated and more of the economy reopens. This should quickly narrow the current economic gap and get people back to work.

Indicators 2 and 3 – New Jersey Goods Trade Flows 

0125TradeFlows_left-(1).jpg 0125TradeFlows_right-(1).jpg

Source: Bureau of the Census

As with all economic shocks, the effect of the pandemic on the economy has not been even across sectors. From where we sit now, almost a year following the initial shock, it is apparent the pandemic has had a bigger impact on face-to-face services than on goods production. That said, production and goods trade have been squeezed.

Since the beginning of the 2020, there has been a scramble among analysts to find data sources that best encompass the economic impact of the pandemic on supply chains, and no metric paints a clearer picture than total trade. Many believed that total trade would take a large hit due to the interruption of supply chains caused by closures, and the data soon backed up these claims.

The figures above show the mapping of the total trade of goods in New Jersey for 2019 and 2020, which illustrate the effect of COVID’s supply-shock and our road to recovery. From February 2020 to May 2020, total trade of goods dropped 32 percent to its lowest point: $9.8 billion. Since then, there has been an increase in total trade for five consecutive months which surpassed New Jersey’s figures for the month of October 2019 by $540M and narrowed our gap from last year’s total to $12.9B. With the worst out of the way and the damage apparent, suppliers are now looking toward the future to recoup their losses and get back on track.

Indicators 4 and 5 – New Jersey Office Leasing Activity and Vacancy Rate

0125officeleasing_left-(1).jpg 0125officeleasing_right-(1).jpg

Source: CoStar

The office and retail Commercial Real Estate (CRE) markets in New Jersey were dealt a significant blow by the pandemic. Unlike the industrial market, which has not only weathered COVID-19 but even benefitted from it in some instances, government shutdowns and social-distancing practices resulted in a sharp downturn in retail and office CRE in 2020.

Prior to the pandemic, New Jersey’s office market appeared well-positioned for steady growth entering 2020. Vacancy rates in 2018 and 2019 were steady, and rents had been rising. Leasing activity had fluctuated over the prior 10 years but remained between 3M-4M sq. ft. per quarter. As seen in the chart below, COVID-19 put an end to that trend. The amount of square footage leased in 2020:Q2-2020:Q4 was 44% percent below the prior five-year average. Office vacancy rates shot higher, from around 19 percent in 2019 to above 23 percent at the end of 2020.

Indicators 6 and 7 – New Jersey Retail Leasing Activity and Vacancy Rate

0125leasing_left.jpg 0125leasing_right.jpg

 Source: CoStar

Despite the frequent commentary that e-commerce is destroying brick-and-mortar retail, retail markets in New Jersey through 2019 had been seeing some growth. Prior to the pandemic, vacancy rates had dropped statewide to 4.5 percent. The chart above shows the recent history of statewide retail vacancy rates from 2007-2021. The expectation is that vacancy will decline as businesses are allowed to reopen and operate at full capacity. The number of direct leasing deals also saw a notable decrease, especially in 2020:Q2. However, deals increased in Q3 and Q4, a positive sign for retail’s recovery from the pandemic.

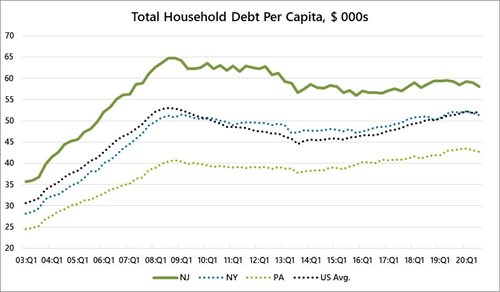
New Jersey households, on average, hold more debt than households in the rest of the US. This is largely a function of home prices being higher than the US average, and mortgage debt accounts for more than 70 percent of New Jersey household debt.  Debt becomes a particular concern during a recession, as the income used to service that debt (pay back interest and principle) can fall or dry up altogether, causing debt payment delinquencies, housing foreclosures, and bankruptcy.

Unlike during other economic downturns, federal and state governments have stepped in to forestall the impact of household debt during the pandemic. These governments have acted in two main ways to provide relief to consumer balance sheets: providing funds directly to households to bridge the income gap and through forbearance on federally-backed debts. The CARES Act provided for a six-month moratorium on payments of federally guaranteed mortgages and student loans. These forbearance periods are renewable for up to twelve months. Moreover, some private lenders voluntarily provided forbearance for auto and other types of loans.

The result has been an actual decline in delinquency rates, foreclosures, and household bankruptcies during the time of the pandemic. Thus, the government’s actions have had a clear positive impact on household balance sheets, reflected in the following charts. But there are significant questions ahead for policy makers. When forbearance ends and households are required to restart payments, will employment and household income have recovered sufficiently to stave off this renewed stress on household balance sheets? The answer to this question will have significant implications for the economy.

Indicator 1 – Household Debt Per Capita

Source: Federal Reserve Bank of New York

New Jersey households hold more debt per capital than the US as a whole. Over 70 percent of New Jersey household debt – approximately $41,000 per household – is in the form of mortgage debt. This mortgage debt share is a bit above the national average of 69 percent. It is interesting to note debt per capita in New Jersey has never rebounded to the level it was at before the Great Recession, which is not the case in other states in the region or for the US as a whole. It is possible New Jersey households on average became more risk-averse than those in other areas of the country. It is also likely an aging population in New Jersey plays some role, as does a lower home ownership rate relative to pre-2008, although these are also factors for the rest of the US.

Indicator 2 – Percent of Household Debt Balance 90+ Days Delinquent

Source: Federal Reserve Bank of New York
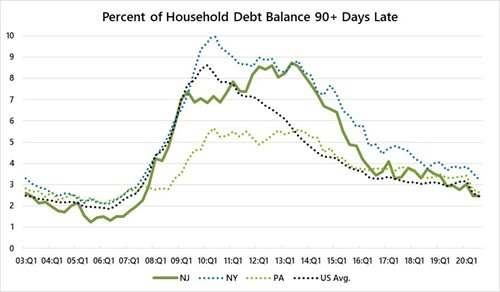
Delinquency rates in New Jersey and the rest of the country have dropped, reflecting the uptake in CARES Act and voluntarily provided forbearance. There are two main impacts of forbearance. One is obvious – the ability to skip or defer debt payments. The other is protection of borrowers’ credit records.

Indicator 3 – Percent of Consumers with New Home Foreclosures

Source: Federal Reserve Bank of New York
*Consumers with credit reports

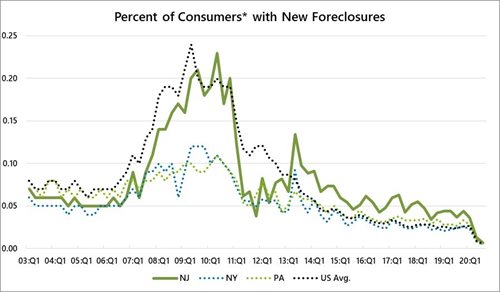
Federally backed mortgages are protected from foreclosure through the CARES act. Thus, foreclosure rates are at all-time lows. In the third quarter of 2020, less than one percent of consumers underwent new home foreclosures.

Indicator 4 – Percent of Consumers with New Bankruptcies

Source: Federal Reserve Bank of New York
*Consumers with credit reports
Moratoriums on debt payments have brought bankruptcy rates to all-time lows. This experience is quite different than what occurred in the immediate aftermath of the Great Recession, when bankruptcy rates in New Jersey tripled.